Data visualization is the graphical representation of information and data. By using visual elements like charts, graphs, and maps, data visualization tools provide an accessible way to see and understand trends, outliers, and patterns in data.
We Make data-driven decision making more intuitive !
Our analytics experts use modern BI tools to provide transformative data visualization & reporting capabilities. Data visualization tools are software applications that render information in a visual format such as a graph, chart, or heat map for data analysis purposes. Such tools make it easier to understand & work with massive amounts of data.
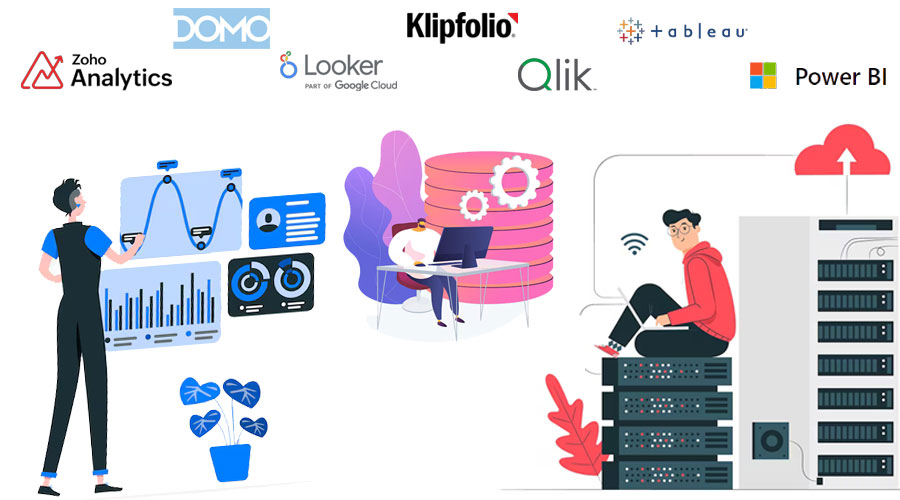
The Best Data Visualization Software of 2024:Microsoft Power BI: Best for business intelligence (BI) Tableau: Best for interactive charts Qlik Sense: Best for artificial intelligence (AI) Klipfolio: Best for custom dashboards Looker: Best for visualization options Zoho Analytics: Best for Zoho users Domo: Best for custom apps
1. Data Visualization: - Stunning, customizable dashboards - Interactive data exploration - Real-time performance tracking - Intuitive data analytics
2. Reporting Services:- Comprehensive reporting capabilities - Automated report generation - Customizable templates - Secure data sharing and distribution
3. Scalability and Integration: - Integration with your systems - Scalable to handle growing data volumes - Robust security & access controls - Flexible deployment options
4. Improved Decision-Making: - Gain deeper insights into your business - Identify trends & patterns - Optimize operations & strategies - Enhance overall business performance
5. Increased Efficiency: - Streamline reporting processes - Reduce manual data entry and errors - Automate routine tasks - Empower your team with self-service analytics
Don't let your data go to waste. Partner with us and unlock the true potential of your information. Contact us today and let our data analytics specialists take your business to new heights.